Bridge
Introduction
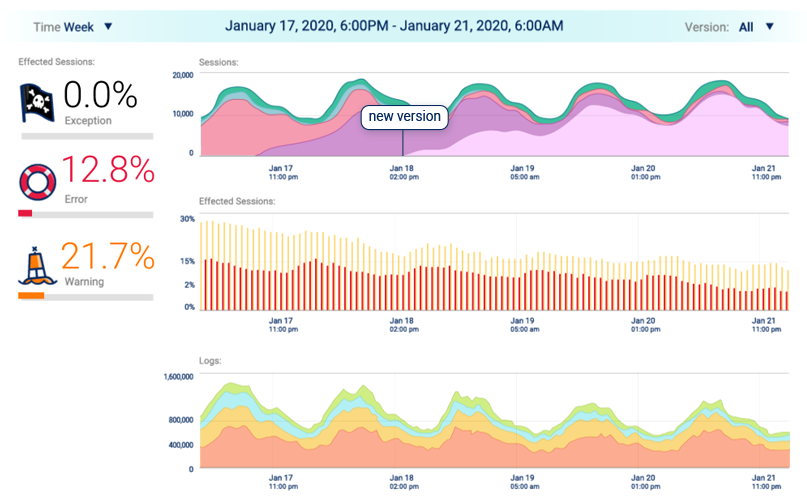
The heartbeat monitor of your app. The Bridge provides in depth graphs of system metrics including log errors and usage per app version over time. For an extensive overview of actual app stability. The graphs below are a direct reflection of the app and log stability:
Affected Devices
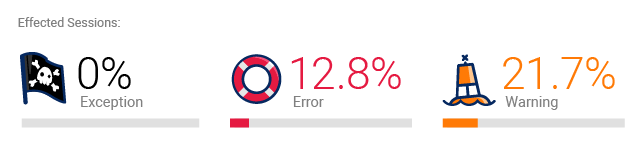
The first feature of the Bridge that should be viewed is the “Affected Devices” on the left console. “Affected devicess” corresponds to the percent of devices affected by logs of a specific severity. They are categorized by exceptions, errors and warnings over the selected time span (daily, weekly, or monthly) and app version.
Affected Devices, corresponds to the number of user devices in which either an error or warning or exception log occurs.
Loglytics Quick Preview
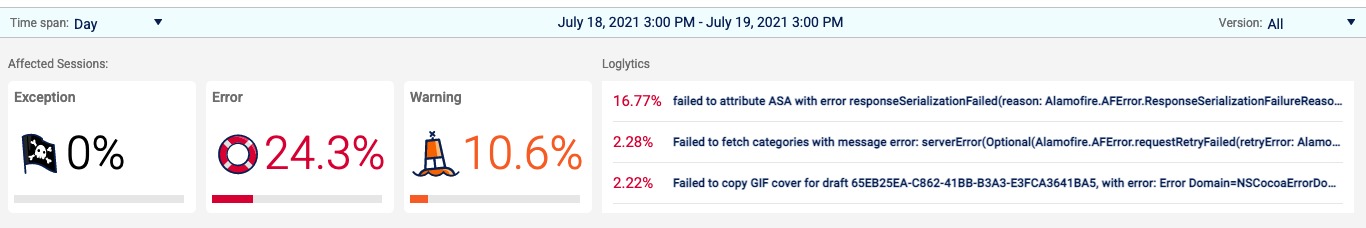
To the right of the Affected devices is a quickpreview of the recurring logs in your app through Loglytics. Clicking on any individual log in the preview list will open up a new window with the Loglytics Item Page. The item page displays all the relevant data of the selected recurring log.
Display Configuration
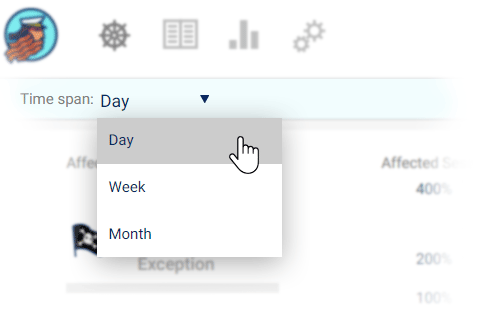
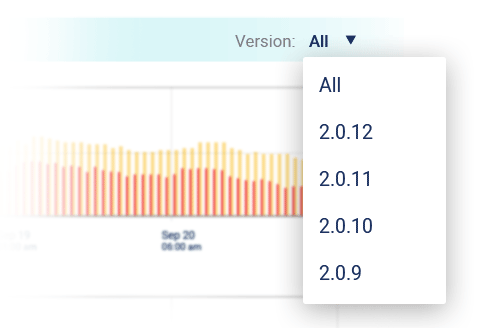
On the top of the Bridge you can choose what time span to view the information in, either hourly, daily, or monthly view.
You can also choose to view a specific app version, or view all of the app’s versions together:
Bridge Graphs
Devices Graph
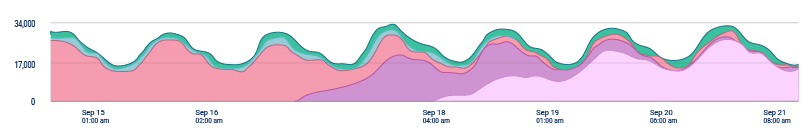
The Devices graph displays the amount of devices in each app version over time. As app upgrades are added, you will be able to view how fast users adopt each new version.
Affected Devices Graph
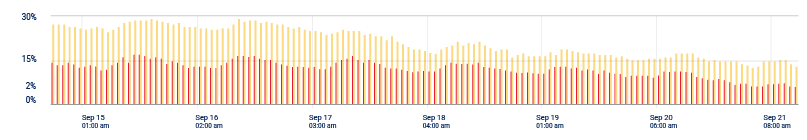
The Affected Devices graph is located at the top of the page and it displays the percentage of devices affected by exceptions, errors, and warnings.
Log Graph (Your Heartbeat Monitor)
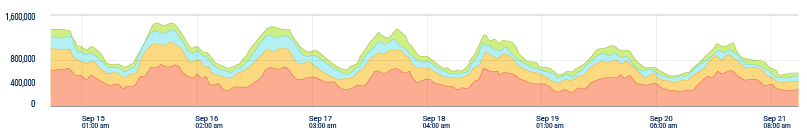
The Log graph, in the middle, displays the amount of logs in the app according to log type at any point in time (exceptions, errors, warnings, info, debug, and verbose)... essentially the heartbeat monitor of your app logs.
Graph Analysis
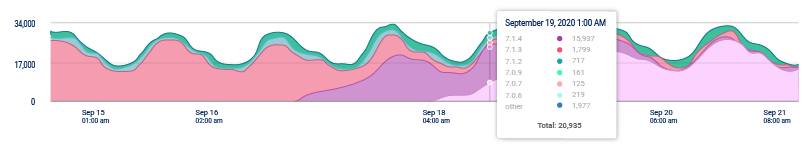
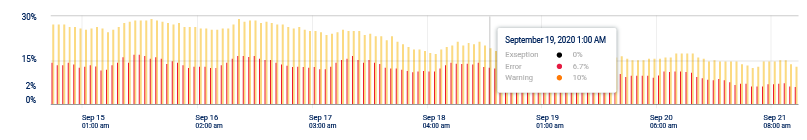
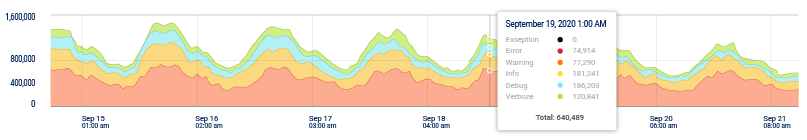
Hovering with the mouse over the graph in each of the above three graphs will open up an info box with the exact amounts or percentages at the specific point in each graph for the corresponding graph data.
The Bridge essentially brings three different graphs of log metrics, which together will give you a clear picture of your app state and stability over time and app versions.
Alert Feature
Shipbook will automatically send alerts to your e-mail in the event that unusual activity or serious errors are detected, so that you can rest assured, when something urgent is needed you are the first to know.
Alternating Between Accounts or Applications
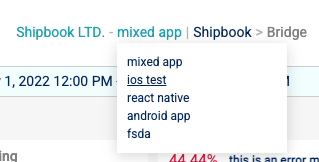
If you have a number of different accounts: Hover over your account name or app name at the top of the console. A drop down will appear with the various accounts or apps under your account. Simply select the account or app of that you wish to view and the console will display that informaiton.