Logbook
Introduction
The Logbook is a highly intuitive and intelligent search engine. Easily find the logs you need to quickly solve any issue. These vast searching capabilities open the door to freely choose the best way for you to look for the source of the bug or issue.
Session Header
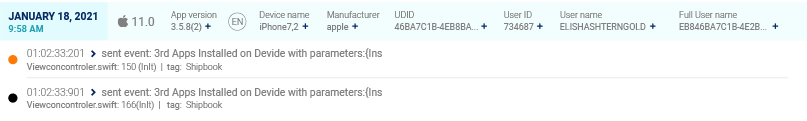
The Logbook is organized according to session. Each session has a blue header indicating the collective information.
The Session header displays:
-
Session start date and time
-
Hardware Info: Manufacturer, Device name
-
Software Info: OS Version, App Version, Device Language
-
User Info: UUID (iOS) / Android ID, User ID, User Name, Full User Name, Email, Phone number, and Custom parameters
Beneath each session header are the logs of that session organized chronologically, in other words, newest logs are displayed at the top of the list.
Log Message Analysis
Selecting the message will open up a window where the comprehensive details of the log are displayed.

The log message displays:
-
Log date and time
-
Log message
-
Log message location in code: File name, File row number, Function name (in parentheses), Tag name
Once a log is selected, a message box will open displaying the complete detail of all of the information from that log:
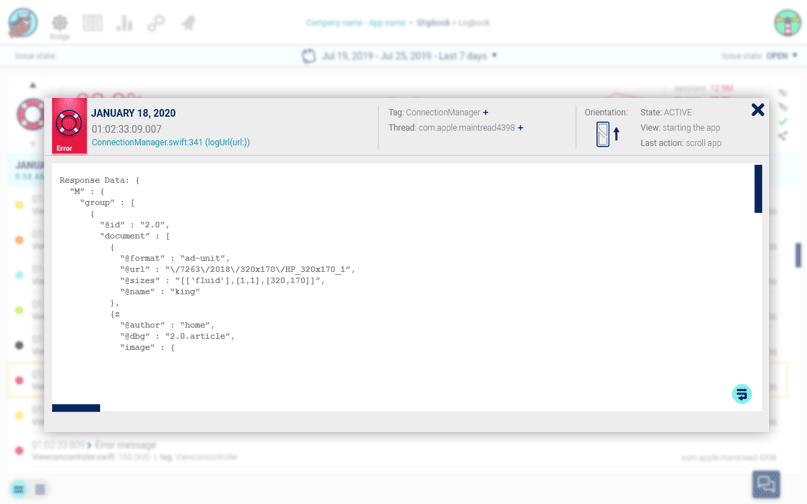
When reviewing the logs in search of the root of a problem, this will provide the developer with invaluable information and detail, allowing for much faster solutions.
For example, in which orientation did the user experience a problem, or does the bug occur in specific telephones or software versions?
*Note: Message text has a limit of 10,000 characters.
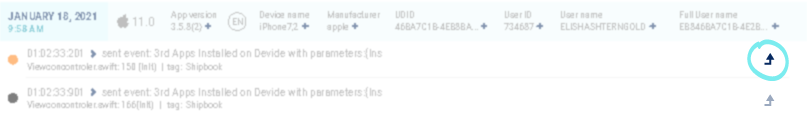
![]() For your convenience, at the bottom left of the message box note a small blue arrow icon- to select whether or not to text wrap the display of the log message.
For your convenience, at the bottom left of the message box note a small blue arrow icon- to select whether or not to text wrap the display of the log message.
Session Configurations:
Go to Session:
Any individual log session can be viewed by clicking on the small arrow (see “Go to Session” icon) on the far right, at the end of each log row.
Session Display:
You can configure the amount of information that you wish to display:
By Selecting the blue icon with the four parallel lines, below the logs list you can choose to view simplified logs alone.
By switching the blue icon to the two large lines, below the logs list, you can choose to have the information displayed in more detail.
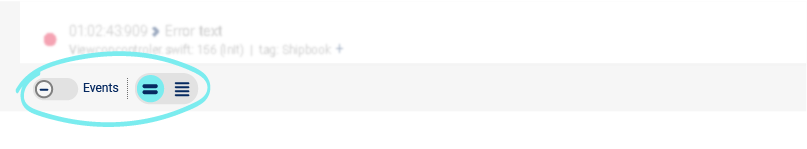
Events Display:
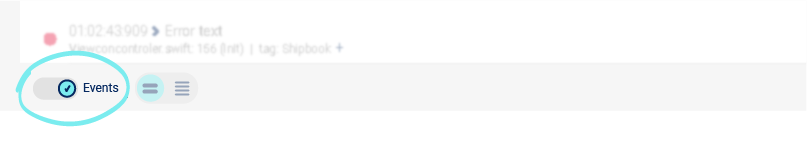
You can switch the events icon “on” or “off” to choose whether or not to display events in the logs list
Search Box
Seek & you shall find In one simple search, find exactly what you are looking for. All the search parameters are in one place.
You can search through your logs with free text search or with parameters such as Device Model, UDID, or App Version. We make these searches even easier with our intuitive autocomplete function.
Search Results Graph
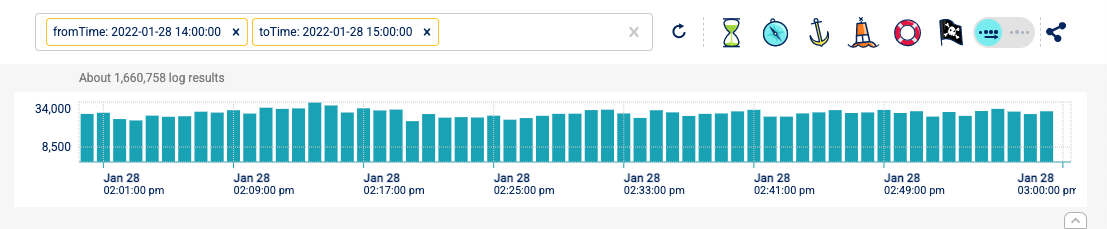
At the top of the console the search results graph displays the amount of logs in your search results over time.
Drag your mouse across the graph to highlight and zoom in “to” and “from” a specific time frame in order to view the search results within the context of that given period. The graph will now display the amount of logs within the time frame you selected.
Next to the search bar, there is a refresh logs button:
 As logs are collected by the system on the fly therefor refresh for the most current logs.
How Does All This Work?
Search using parameters:
Searchable Parameters:
| Parameter | Description |
|---|---|
msg | Free text - Message (see Message Search for advanced options) |
regex | Regular expression pattern (see Regex Search) |
Manufacturer | Device Manufacturer |
deviceModel | Device Model |
udid | UDID |
appVersion | App Version |
tag | The Log Tag |
userId | User Id |
userName | User Name |
fullName | User Full Name |
email | User Email |
phoneNumber | User phone number |
fromTime | Limit search from start date |
toTime | Limit search to end date |
Message Search
The msg parameter supports advanced search capabilities:
Regular Word Matching
By default, searching for multiple words will find logs containing all words in any order:
msg=Decoding error- Finds logs containing both "Decoding" and "error" anywhere in the message
Exact Phrase Matching
Use quotes to search for exact phrases, preserving word order:
msg="Decoding error"- Finds only logs with the exact phrase "Decoding error" in that ordermsg='Decoding error'- Single quotes also work for exact phrase matching
Example: Searching for msg="Decoding error" will match:
- ✅ "Decoding error occurred"
- ✅ "Decoding error"
- ❌ "error Decoding happened" (wrong word order)
- ❌ "Decoding successful" (missing "error")
Negation (Exclusion)
Use - or ! prefix to exclude logs matching the search term:
msg=-Decoding- Excludes all logs containing "Decoding"msg=-"Decoding error"- Excludes logs with the exact phrase "Decoding error"msg=!'Decoding error'- Alternative syntax using!prefix
Example: Searching for msg=-"Decoding error" will return all logs except those containing the exact phrase "Decoding error".
Combining Multiple Messages
You can combine multiple message searches (OR logic):
msg="Decoding error"&msg="Some other"- Finds logs matching either phrase
Regex Search
The regex parameter allows you to search using regular expression patterns:
regex=error.*occurred- Finds logs matching the regex patternregex=^Decoding- Finds logs starting with "Decoding"regex=error$- Finds logs ending with "error"
Note: Regex searches operate on analyzed text fields, so they work on individual tokens rather than the raw string. For exact phrase matching, use the msg parameter with quotes instead.
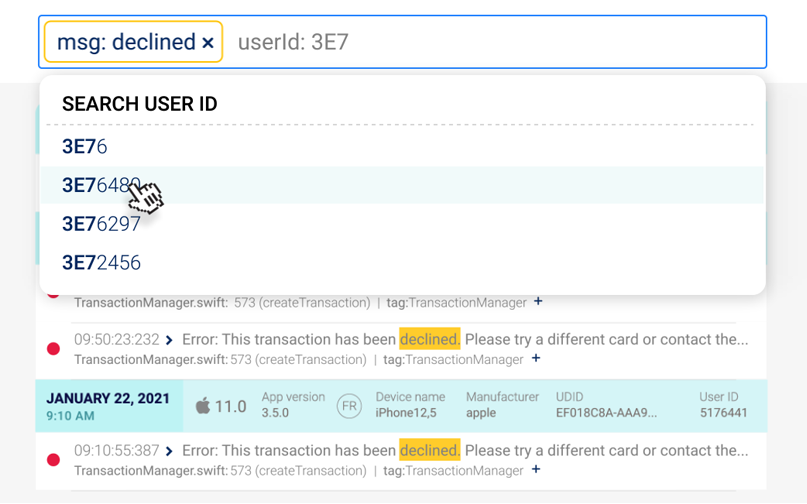
Autocomplete:
Use the intuitive dropdown autocomplete function to search by specific user Email, User ID, etc.
Adding Parameters:
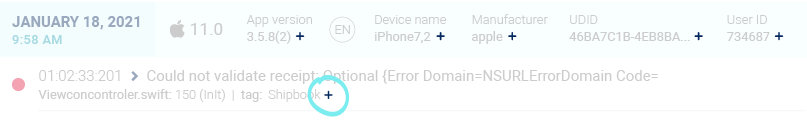
You can add parameters by clicking on the small plus sign (+) that appears in the session and log. These will now become searchable parameters.
*Note: The search field can be used to enter all search parameters and variables. You can easily combine search parameters to refine your search. For example: MSG+ UDID
Severity Icons
![]()
Notice, on the top right, six severity icons that allow you to control how you prefer to search. From left to right the icons allow you to automatically organize your logs based on log severity:
- Verbose
- Debug
- Info
- Warning
- Error
- Exception
The switch button on the far right allows you to view either:
- From severity: View logs according to the minimum severity level selected Or-
- Specific severity: View logs according to specific severity level selected
Share
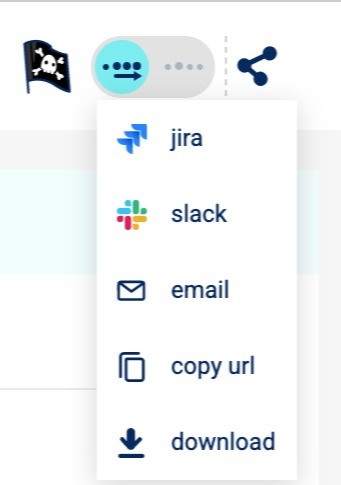
The share button gives you the option to share the current search result via Jira, Slack, email, copy URL, and download log data.
Note: Alternating Between Companies or Applications within one account
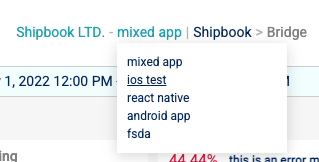
If you have a number of different companies within your account: Hover over your company name or app name at the top of the console. A drop down will appear with the various companies or apps under your account. Simply select the company or app that you wish to view and the console will display that information.